Hawaiki Tower Analysis – An alternative to traditional comps and adjustments.
July 22, 2013
For many appraisers in Hawaii, a common but challenging assignment is to value a single unit in a high-rise luxury condominium project.
There are dozens of luxury high-rises in Honolulu. This article takes a look at Hawaiki Tower, a 46-story condominium with 417 residential units. It is situated immediately across the street from Ala Moana Shopping Center and benefits from highly desirable ocean views.
 Photo Credit: Mathew Ngo – REALTOR®
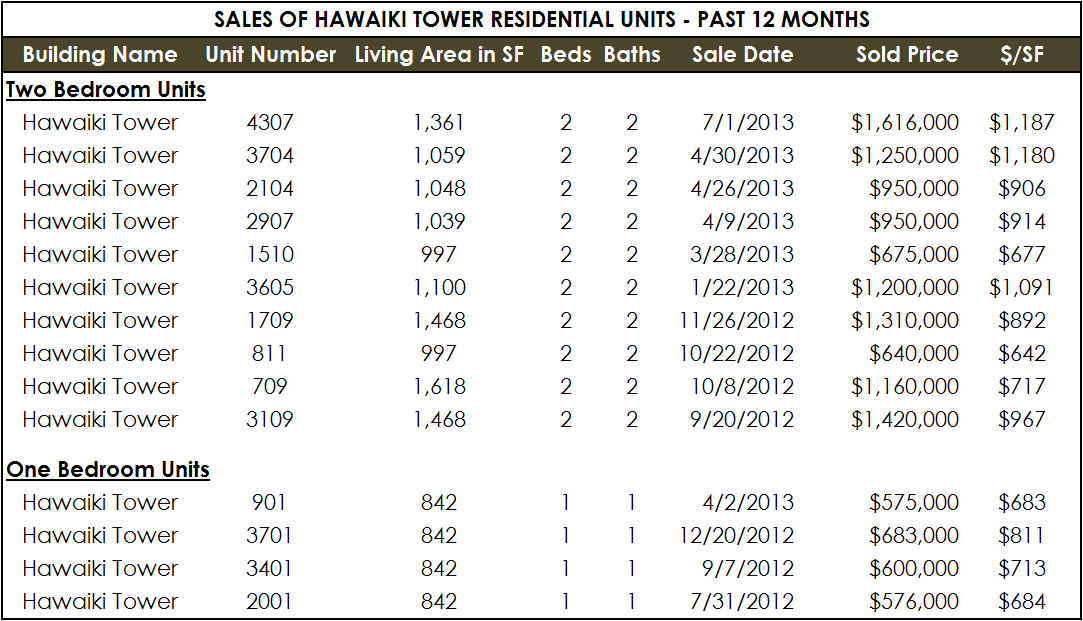
At first, it might seem straightforward to value a unit in this building. For example, in the past 12 months, 14 residential units at Hawaiki Tower have sold, as shown in the chart below:
 Sources: HiCentral MLS, and Chris Ponsar, MAI
From an appraiser’s point of view, what’s not to love? We’ve got a bunch of seemingly clean data to work with. This is largely true, but a closer look reveals the following:
- 10 sales of two-bedroom units in the past year, and 4 sales of one bedroom units.
- Floor levels range from 8 to 43
- Unit sizes range from 842 to 1,618 square feet of living area.
- Sale prices range from $575,000 to $1,616,000
- Prices per square foot range from $642 to $1,187
In other words, sale prices and unit characteristics fall in a wider range than one might expect, and an appraiser looking at any particular unit will be challenged to provide solid market support for adjustments. Not impossible, but definitely difficult.
Let’s look at an alternative: The Multiplier Method
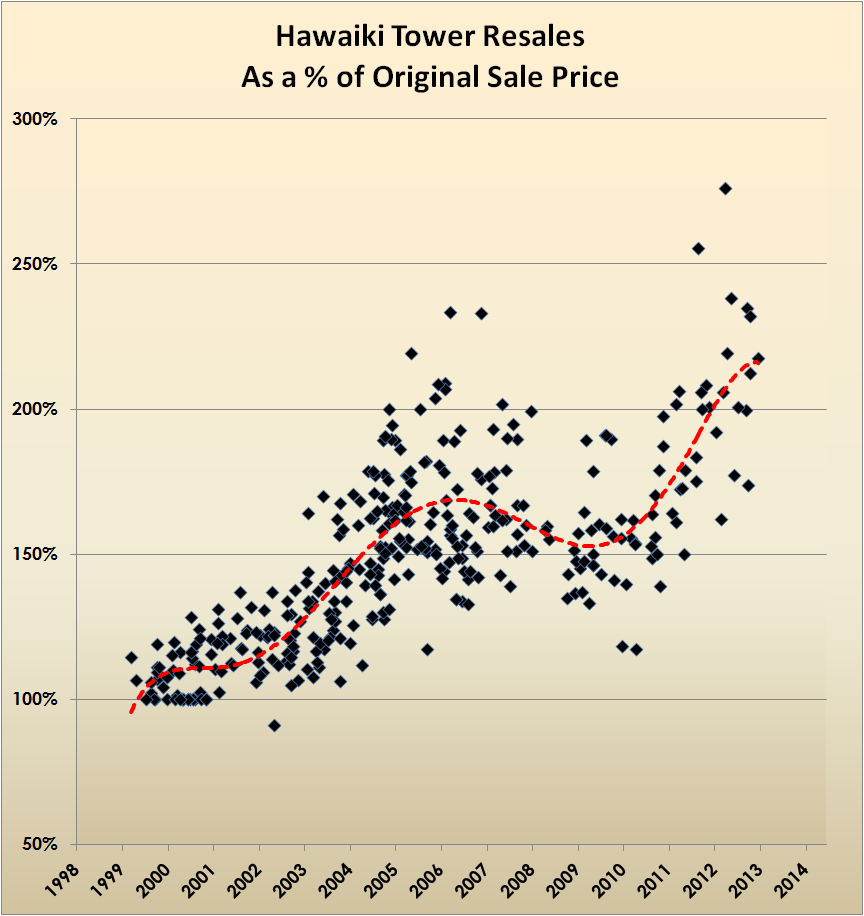
The following chart tracks resales at Hawaiki Tower since construction completion in 1999.
 Sources: HiCentral MLS, Hawaii Information Service, and Chris Ponsar, MAI
At first, this might appear to be a summary of run-of-the-mill sale prices, but it isn’t. This chart tracks each sale price at Hawaiki Tower as a percent of its original developer’s sale price. As shown, the 150 percent threshold was crossed sometime around 2004, with the march past 200 percent taking shape in 2012. (We’re definitely getting into appraiser geek stuff here)
The benefits of this approach are rooted in the idea that when Hawaiki Tower was first completed and sold out in 1999-2001 (a time of relatively stable pricing where almost 75 percent of the project closed in the first 12 months after completion), the developer and more than 400 buyers came to individual agreements on price. Buyer preferences for items such as ocean view, unit size, floor level, floor plan, etc are “baked in” to the original developer closing prices.
If we take another look at the Hawaiki Tower sales from the previous 12 months, a tighter trend reveals itself in the “% of original price” and “multiplier” columns:

In the prior 12 months, on average, the 10 two-bedroom sales at Hawaiki Tower traded for 2.2x their original sale prices. One-bedroom units are trailing a bit, selling for about 1.9x the original developer’s price–a possible indication that one-bedroom units are less desirable, in comparison to two-bedroom units, than they were in 1999, a market preference that many real estate agents and appraisers have observed.
What does it all mean?
Based on the sales activity at Hawaiki Tower over the past 12 months, units have closed in the range of 1.6-2.8x original prices, with most activity happening in the 1.9-2.3x range. As a property owner, real estate agent, or other professional interested in market value, it would seem reasonable to set value expectations in these ranges.
If you’re interested to know what your unit sold for originally in the 1999-2001 sell out period, send me a note and I’ll zip it over to you (the whole 400-unit list seems a bit overwhelming for this article). Alternatively, you can look up the public record sales activity for any property on Oahu at http://www.honolulupropertytax.com. Go to the property search tab and enter your address or tax map key if you know it (again, drop me a line if I can help).
Comments and/or Questions? Please leave them in the comments section below–I’d be happy to clarify or expand.
Aloha, Chris


Recent Comments