Current Kakaako Development Projects

The Hawaii Community Development Authority has just posted an updated list of project activity in the Kaka’ako Community Development District (KCDD).

Kakaako - Ward Neighborhood Master Plan Phasing Diagram

Four Kakaako projects totaling 1,541 units are under construction, including Waihonua (A&B), 801 South Street (Downtown Capital LLC), Symphony Honolulu (Oliver McMillan), and the Waiea tower at Ward (Victoria Ward/Howard Hughes).

Nine additional projects totalling 2,587 units have also been approved.

A PDF copy of the list can be downloaded here (Current Kakaako Project Activity).   Project information is updated at this link: http://dbedt.hawaii.gov/hcda/projects/

Please read my disclaimer.

Maui Million Dollar Home Sales ($1.0M+) – Day 5 of 10 – Price Per Square Foot

From January 1, 2012 through September 16, 2013, a total of 231 “million dollar plus” homes sold in Maui County, generating total volume in excess of $525 million.  There are many ways that Hawaii real estate appraisers analyze sales statistics for luxury homes.  Because a proper market study for this segment would run many pages, I am posting one article per day for ten days.

Day 5 of 10 – Maui Million Dollar ($1.0M+) Single Family Homes By Price Per Square Foot Of Living Area

Consider the following graph and chart, which measures each of the million dollar sales divided by their respective living areas in square feet:

Maui Million Dollar Sales By Price Re Square Foot

Maui Million Dollar Sales By Price Per Square Foot


Island of Maui Million Dollar Single Family Homes By Price Per Square Foot Of Living Area
Sold From 1/1/2012 through 9/16/2013
Price Per Square Foot # of Sales % of Total
$0-$250 2 0.9%
$250-$500 81 35.1%
$500-$750 77 33.3%
$750-$1000 36 15.6%
$1000-$1250 14 6.1%
$1250-$1500 7 3.0%
$1500-$1750 4 1.7%
$1750-$2000 2 0.9%
$2000-$2250 2 0.9%
$2250-$2500 2 0.9%
$2500-$2750 1 0.4%
$2750-$3000 1 0.4%
$3000-$3250 0 0.0%
$3250-$3500 0 0.0%
$3500-$3750 1 0.4%
$3750-$4000 1 0.4%
Total 231 100.0%

More than 90 percent of Maui’s million dollar home sales in the study period fall in the “price per square foot” range of $250 to $1,250, with the $250 to $1,000 range accounting for 84 percent of the transactions.

Maui real estate agents that are active in the luxury sector report that the high-end/luxury market typically begins at the $1,000 per square foot level.  The sub-$1,000 data shows how raw demand for Maui residences generates a great number of high dollar ($1.0 M plus) sales for “less-than-luxury” homes.

The two sales that cleared the $3,000 per square foot level did so for different reasons: one was a prime white sand beach home on South Kihei Road that sold for $23.0 million.  The other was an older/smaller cottage on an amazing 1.1 acre oceanfront lot near Paia–the high price per square foot of living area was due to the largely insignificant improvements on a very valuable piece of land.

Bottom Line: At least on Maui, a million bucks doesn’t go as far as it used to.

At these prices, it is easy to see how a Maui real estate appraiser could be regularly confronted with homes that sell for prices that easily exceed Fannie Mae, Freddie Mac, and FHA conforming loan limits.

Questions or comments?  Please leave them in the comment  box below, I would be happy to clarify and/or expand.

Aloha, Chris

Maui Million Dollar Home Sales ($1.0M+) – Day 4 of 10 – “Who Sold Them”?

From January 1, 2012 through September 16, 2013, a total of 231 “million dollar plus” homes sold in Maui County, generating total volume in excess of $525 million.  There are many ways that Hawaii real estate appraisers analyze sales statistics for luxury homes.  Because a proper market study for this segment would run many pages, I am posting one article per day for ten days.

Day 4 of 10 – Maui Million Dollar ($1.0M+) Single Family Homes By Agent

Consider the following graph and chart, 24 agents have sold four or more “million dollar homes” in the study period (ties sorted by first name alphabetical order):

Maui Million Dollar Home Sales By Agent

Maui Million Dollar Home Sales By Agent

Maui Million Dollar Single Family Home Sales By Agent
Sold From 1/1/2012 through 9/16/2013

Rank

Agent Name
# of
$1.0M+ Sales
1 Wendy R Peterson 11
1 William B Moffett Jr. 11
3 Robert H Dein 10
4 Mary Anne Fitch 8
5 Lori L Powers 7
5 Robert R Myers 7
5 Tom Tezak 7
8 John H Page-Papazian 6
8 Steve Blackington 6
10 Bob Hansen 5
10 Debbie Arakaki 5
10 Dennis Rush 5
10 Jeremy Stice 5
10 Martin Hauen-Limkilde 5
10 Nancy J Callahan 5
10 Vincent Palmieri 5
17 Courtney M Brown 4
17 Cynthia Warner 4
17 Dano Sayles 4
17 Diane K Pool 4
17 Jeannie Kong 4
17 Josh Jerman 4
17 Kathy Ross 4
17 Riette G Jenkins 4

Bottom Line: This is the big time.

No analysis required.  This data speaks for itself.  We’re talking about real estate professionals at the top of their game here.  They all deserve aloha and praise!

Questions or comments?  Please leave them in the comment  box below, I would be happy to clarify and/or expand.

Aloha, Chris

Maui Million Dollar Home Sales ($1.0M+) – Day 3 of 10 – “How Big Are They?”

From January 1, 2012 through September 16, 2013, a total of 231 “million dollar plus” homes sold in Maui County, generating total volume in excess of $525 million.

There are many ways that Hawaii real estate appraisers analyze sales statistics for luxury homes.  Because a proper market study for this segment would run many pages, I am posting one article per day for ten days.

Day 3 of 10 – Maui Million Dollar ($1.0M+) Single Family Homes By Living Area

Consider the following graph and chart:

Maui Million Dollar Sales By Living Area

Maui Million Dollar Sales By Living Area

Maui Million Dollar Single Family Homes By Living Area
Sold From 1/1/2012 through 9/16/2013
Living Area in SF # of Sales % of Total
0-999 5 2.2%
1000-1999 32 13.9%
2000-2999 68 29.4%
3000-3999 75 32.5%
4000-4999 28 12.1%
5000-5999 17 7.4%
6000-6999 2 0.9%
7000-7999 2 0.9%
8000-8999 1 0.4%
9000-10000 1 0.4%
Total 231 100.0%

Luxury homes having between 2,000 and 4,000 square feet of living area represent the “sweet spot” of the Maui luxury market, comprising more than 60 percent of the Valley Isle’s million dollar home sales since the beginning of 2012.

Bottom Line: Bigger Isn’t Necessarily Better

97.4 percent of all “million dollar plus” single family homes sold on Maui since 2012 have 6,000 square feet of living area or less.  While it is certainly possible to build larger residences, and some very wealthy individuals have, if you’re building much larger than 5,000 square feet, you might be going beyond what the market prefers.

Questions or comments?  Please leave them in the comment  box below, I would be happy to clarify and/or expand.

Aloha, Chris

Bonus  – Superadequacy

The data above suggests that building much larger than 5,000 square feet may not be consistent with market preferences.  If true, real estate appraisers refer to this phenomena as a “superadequacy”, which is defined below:

superadequacy

An excess in the capacity or quality of a structure or structural component; determined by market standards.

Source: Appraisal Institute, The Dictionary of Real Estate Appraisal, 5th ed. (Chicago: Appraisal Institute, 2010

Maui Million Dollar Home Sales ($1.0M+) – Day 2 of 10 – Sale Prices

From January 1, 2012 through September 16, 2013, a total of 231 “million dollar plus” homes sold in Maui County, generating total volume in excess of $525 million.

There are many ways that Hawaii real estate appraisers analyze sales statistics for luxury homes.  Because a proper market study for this segment would run many pages, I am posting one article per day for ten days.

Day 2 of 10 – Maui Million Dollar ($1.0M+) Single Family Homes By Sale Price

Consider the following graph and chart:

Maui Million Dollar Homes By Sale Price

Maui Million Dollar Homes By Sale Price

Maui Million Dollar Single Family Homes By Sale Price
Sold From 1/1/2012 through 9/16/2013
Sale Price # of Sales % of Total
$1.0 M to $1.9 M 157 68.0%
$2.0 M to $2.9 M 31 13.4%
$3.0 M to $3.9 M 18 7.8%
$4.0 M to $4.9 M 9 3.9%
$5.0 M to $5.9 M 5 2.2%
$6.0 M to $6.9 M 2 0.9%
$7.0 M to $7.9 M 1 0.4%
$8.0 M to $8.9 M 4 1.7%
$9.0 M to $9.9 M 3 1.3%
More than $10.0 M 1 0.4%
Total 231 100.0%

The data shows a predictable trend, with more than 80 percent of the “one million plus” sales on Maui being in the “under $3.0 million” price range.  Although a handful of high profile Maui luxury homes have sold in the past few years for prices in excess of $20.0 million, MLS records show only one residence eclipsing $10.0 million since January 1, 2012.

Bottom Line: Price Matters

There is healthy market activity in Maui’s “million dollar plus” category, but the overwhelming majority of sales (nearly 90 percent) sold for less than $4.0 million.

Questions or comments?  Please leave them in the comment  box below, I would be happy to clarify and/or expand.

Aloha, Chris

Maui Million Dollar Home Sales ($1.0M+) – Day 1 of 10 – “Where are the million dollar homes located?”

Since January 1, 2012, a total of 231 “million dollar plus” homes have sold in Maui County, generating a total dollar volume in excess of $525 million.

There are many ways that Hawaii real estate appraisers analyze luxury sales statistics.  Because a proper market study for this segment would run many pages, I will be posting one analysis per day for the next ten days.

Day 1 of 10 – Maui Million Dollar ($1.0M+) Single Family Homes By District

Consider the following graph and chart:

Day 1 - Maui $1.0M Sales By District

Maui Million Dollar Home Sales By District

Maui Million Dollar ($1.0M+) Single Family Homes By District
Sold From 1/1/2012 through 9/16/2013
District # of Sales % of Total
Wailea / Makena 42 18.2%
Lahaina 24 10.4%
Kaanapali 23 10.0%
Kula / Ulupalakua / Kanaio 20 8.7%
Maui Meadows 19 8.2%
Kihei 16 6.9%
Haiku 15 6.5%
Kapalua 15 6.5%
Spreckelsville / Paia / Kuau 15 6.5%
Makawao / Olinda / Haliimaile 11 4.8%
Napili / Kahana / Honokowai 11 4.8%
Wailuku 5 2.2%
Lanai 4 1.7%
Pukalani 3 1.3%
Molokai 2 0.9%
Olowalu 2 0.9%
Hana 1 0.4%
Kahakuloa 1 0.4%
Kipahulu 1 0.4%
Maalaea 1 0.4%
Total 231 100.0%

Maui’s three resort districts of Wailea / Makena, Kaanapali, and Kapalua are in bold.  As shown, almost 35 percent of Maui’s million dollar home sales since January 1, 2012 come from these three master planned communities. The second tier visitor areas of Lahaina, Kihei, and Napili/Kahana/Makawao log an additional 22 percent of the “million dollar” single family home sales on the Valley Isle.

Maui Resort and Second Tier Neighborhoods

Maui Resort and Second Tier Neighborhoods


Bottom line:  Location matters.

While upcountry locales are showing strong sales figures in the million dollar and above segment, Maui’s master planned resorts of Wailea/Makena, Kaanapali, and Kapalua lead the way.

Questions or comments?  Please leave them in the comment  box below, I would be happy to clarify and/or expand.

Aloha, Chris

Correlation, Schmorrelation!

WARNING: We’re going DEEP into real estate appraiser-geek-land!

A couple of articles ago, I looked at the relationship between housing affordability in Hawaii and The Aloha State’s median prices for single family homes and condominiums.

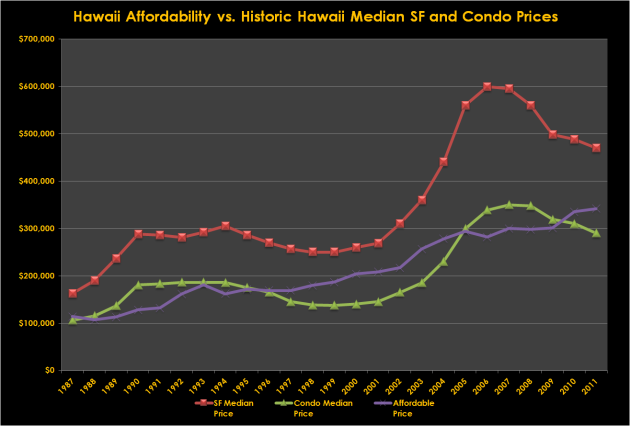
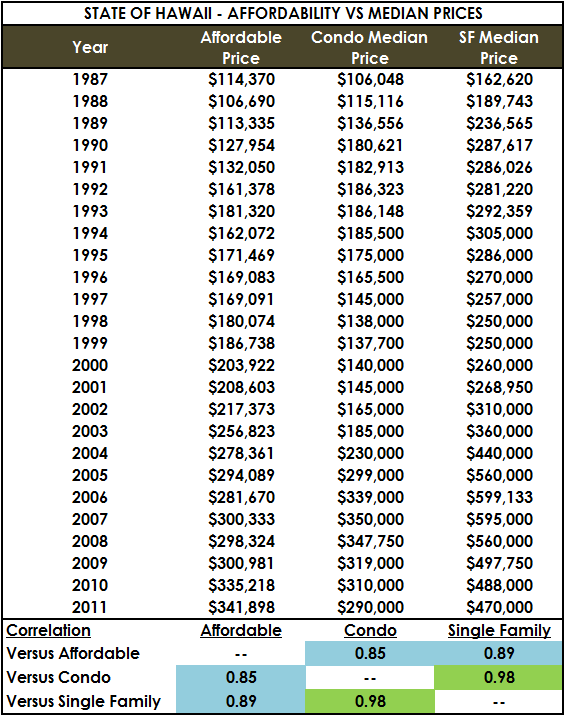
You might recall this chart, which compares Hawaii trends from 1987 through 2011:

Hawaii Home Affordability vs Median Prices

The purpose of this article is to dig deeper into explaining how the affordable price trend, while obviously headed in the same general direction as Hawaii median price trends, does not necessarily correlate with them mathematically on a year to year basis.

As I said in my earlier post:

The red and green trendlines track single family and condominium prices in the study period–as shown, condos and single family home prices track pretty well.

How about affordability (the purple trendline) based on interest rates ?

The long term trend is clearly positive for all variables, with affordable price, condo price, and single family price all being about 3x higher in 2011 than they were in 1987.

But that’s not the question most folks are asking.  The market participants I talk to are generally trying to answer the question “If interest rates go up (this year, or next year), will prices go down (this year, or next year)?”  Is it a causal relationship?

What do you think?  Personally, beyond long term growth, I don’t see a strong relationship in the data, and neither is a solid correlation revealed in geeky statistical analyses.

The people want to know: If interest rates go up (which means affordability goes down), does that mean prices go down?

I warned you, Hawaii real estate appraiser geek stuff:

Let’s just get this out of the way before I get a bunch of emails from anal appraisers: Correlation does not prove Causation.  For a quick explanation of the difference, please consult one of my idols, Sal Khan.

Now that we all agree that correlation does not prove causation (just because healthy people eat breakfast doesn’t mean eating breakfast makes you healthy), let’s move on to the question of whether interest rate changes correlate with movement in Hawaii single family and condominium median prices.

Correlations, positive or negative, can be weak or strong.

Positive correlations are assigned a score between 0.00  and 1.00.   A  zero score (0.00) means there is no correlation (the weakest measure). A score of 1.00 is a perfect positive correlation (the strongest measure).  As the correlation gets closer to 1.00, it is getting stronger. So, a correlation of 0.75 is stronger than 0.55, and a 0.35 is weaker than a 0.45.

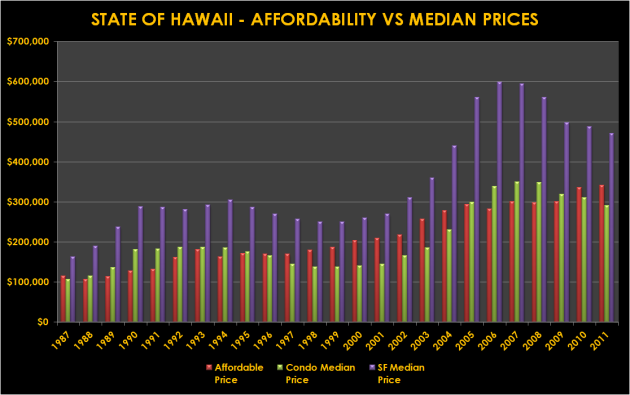
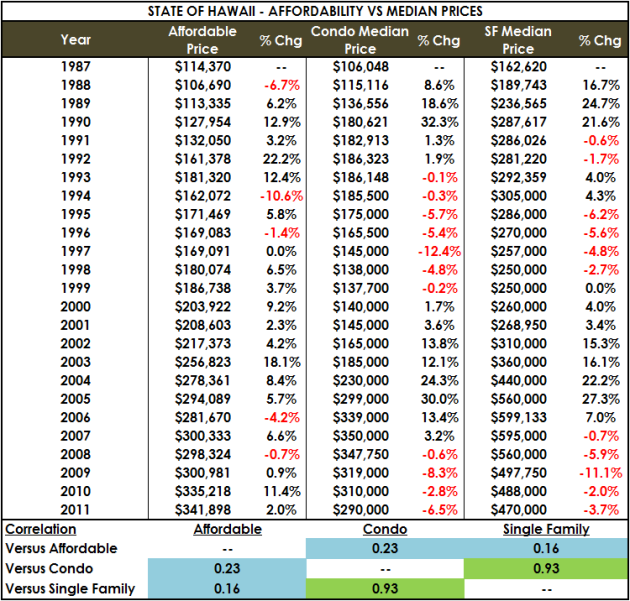
Let’s look at the raw numbers first:

State of Hawaii Median Prices versus Affordability

CORREL - Hawaii Home Affordability vs Median Prices


As shown in the table and graph, affordability numbers, over the long haul, have a pretty good correlation with long term trends (highlighted in blue), scoring a 0.85 against condominium median prices and a 0.89 against single family median prices.

Pretty impressive!  But easily trumped by the 0.98 score logged by condos against single family prices! (highlighted in green)

In this analysis, over the long term, affordability is absolutely heading in the same direction, and in a “kinda-sorta” similar magnitude, as median residential prices.

“But that’s not the question most folks are asking.”

How about my earlier idea, that what market participants really want to know is: “If interest rates go up (this year, or next year), will prices go down (this year, or next year)?”  Is it a causal relationship?

The way to test this question is shown below.  How does the “year over year” percent change in affordability track with the same year’s percent change for residential product?

State of Hawaii Median Prices versus Affordability Percent Change

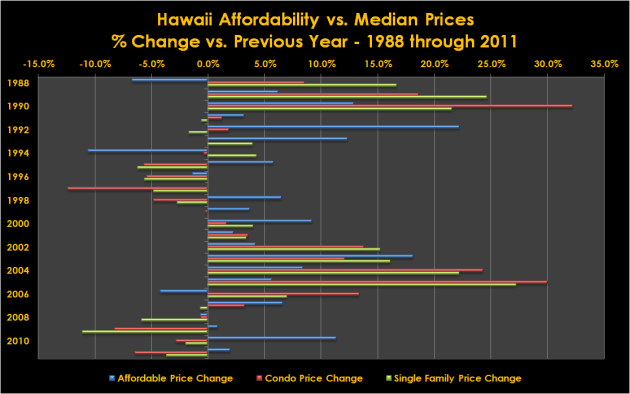
The blue lines don’t match so well with the red and green.

CORREL - Hawaii Affordability Change vs Median Change

Take another look at the affordable versus condo/single family correlations.  Not Pretty.

How about condo versus single family?  Still going strong!

Conclusion?

There is absolutely no doubt that interest rates and overall home affordability head in the same “long term” direction as median prices.  But if you are a real estate appraiser and are asked to opine on the idea of whether or not interest rates/affordability track with median prices, think carefully before knee-jerking your response.  I say “not so much”, at least in Hawaii.

Questions, comments?  Please leave them in the comment box below, I would be honored to clarify and/or expand.

Aloha, Chris