Maui Million Dollar Home Sales ($1.0M+) – Day 4 of 10 – “Who Sold Them”?

From January 1, 2012 through September 16, 2013, a total of 231 “million dollar plus” homes sold in Maui County, generating total volume in excess of $525 million.  There are many ways that Hawaii real estate appraisers analyze sales statistics for luxury homes.  Because a proper market study for this segment would run many pages, I am posting one article per day for ten days.

Day 4 of 10 – Maui Million Dollar ($1.0M+) Single Family Homes By Agent

Consider the following graph and chart, 24 agents have sold four or more “million dollar homes” in the study period (ties sorted by first name alphabetical order):

Maui Million Dollar Home Sales By Agent

Maui Million Dollar Home Sales By Agent

Maui Million Dollar Single Family Home Sales By Agent
Sold From 1/1/2012 through 9/16/2013

Rank

Agent Name
# of
$1.0M+ Sales
1 Wendy R Peterson 11
1 William B Moffett Jr. 11
3 Robert H Dein 10
4 Mary Anne Fitch 8
5 Lori L Powers 7
5 Robert R Myers 7
5 Tom Tezak 7
8 John H Page-Papazian 6
8 Steve Blackington 6
10 Bob Hansen 5
10 Debbie Arakaki 5
10 Dennis Rush 5
10 Jeremy Stice 5
10 Martin Hauen-Limkilde 5
10 Nancy J Callahan 5
10 Vincent Palmieri 5
17 Courtney M Brown 4
17 Cynthia Warner 4
17 Dano Sayles 4
17 Diane K Pool 4
17 Jeannie Kong 4
17 Josh Jerman 4
17 Kathy Ross 4
17 Riette G Jenkins 4

Bottom Line: This is the big time.

No analysis required.  This data speaks for itself.  We’re talking about real estate professionals at the top of their game here.  They all deserve aloha and praise!

Questions or comments?  Please leave them in the comment  box below, I would be happy to clarify and/or expand.

Aloha, Chris

Maui Million Dollar Home Sales ($1.0M+) – Day 1 of 10 – “Where are the million dollar homes located?”

Since January 1, 2012, a total of 231 “million dollar plus” homes have sold in Maui County, generating a total dollar volume in excess of $525 million.

There are many ways that Hawaii real estate appraisers analyze luxury sales statistics.  Because a proper market study for this segment would run many pages, I will be posting one analysis per day for the next ten days.

Day 1 of 10 – Maui Million Dollar ($1.0M+) Single Family Homes By District

Consider the following graph and chart:

Day 1 - Maui $1.0M Sales By District

Maui Million Dollar Home Sales By District

Maui Million Dollar ($1.0M+) Single Family Homes By District
Sold From 1/1/2012 through 9/16/2013
District # of Sales % of Total
Wailea / Makena 42 18.2%
Lahaina 24 10.4%
Kaanapali 23 10.0%
Kula / Ulupalakua / Kanaio 20 8.7%
Maui Meadows 19 8.2%
Kihei 16 6.9%
Haiku 15 6.5%
Kapalua 15 6.5%
Spreckelsville / Paia / Kuau 15 6.5%
Makawao / Olinda / Haliimaile 11 4.8%
Napili / Kahana / Honokowai 11 4.8%
Wailuku 5 2.2%
Lanai 4 1.7%
Pukalani 3 1.3%
Molokai 2 0.9%
Olowalu 2 0.9%
Hana 1 0.4%
Kahakuloa 1 0.4%
Kipahulu 1 0.4%
Maalaea 1 0.4%
Total 231 100.0%

Maui’s three resort districts of Wailea / Makena, Kaanapali, and Kapalua are in bold.  As shown, almost 35 percent of Maui’s million dollar home sales since January 1, 2012 come from these three master planned communities. The second tier visitor areas of Lahaina, Kihei, and Napili/Kahana/Makawao log an additional 22 percent of the “million dollar” single family home sales on the Valley Isle.

Maui Resort and Second Tier Neighborhoods

Maui Resort and Second Tier Neighborhoods


Bottom line:  Location matters.

While upcountry locales are showing strong sales figures in the million dollar and above segment, Maui’s master planned resorts of Wailea/Makena, Kaanapali, and Kapalua lead the way.

Questions or comments?  Please leave them in the comment  box below, I would be happy to clarify and/or expand.

Aloha, Chris

Interest Rates and Hawaii Residential Prices–Are They Really Connected?

I posted an article a few days ago that examined the theoretical relationship between interest rates and purchasing power.  The calculations beg the question “are interest rates and Hawaii home prices actually connected?”

Logic says “of course!”, the data suggests “not so much!”

Let’s assume a 20 percent down payment, market loan fees (points), and monthly payments of 35 percent of a household’s gross income.

The following chart shows State of Hawaii median income, condominium median prices, single family median prices, and national average interest rates for 30-year mortgages from 1987 through 2011 (the latest year for which all data points are available).

Sources: U.S. Census Bureau, Freddie Mac, Hawaii State Data Book, and Chris Ponsar, MAI

Based upon the income and interest rates shown, the median Hawaii family could afford a monthly payment of $1,021 in 1987, and $1,722 in 2011.  These payments equate to affordable home prices of $114,370 in 1987, and $341,898 in 2011. (A pretty hefty increase in purchasing power, driven largely by lower interest rates)

Lets see how the figures track with historic price fluctuations in the Hawaii residential real estate market.

Hawaii Home Affordability vs Median Prices

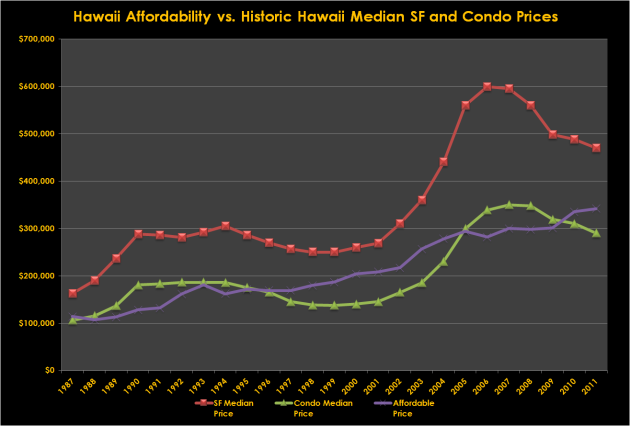
The red and green trendlines track single family and condominium prices in the study period–as shown, condos and single family home prices track pretty well.

How about affordability (the purple trendline) based on interest rates ?

The long term trend is clearly positive for all variables, with affordable price, condo price, and single family price all being about 3x higher in 2011 than they were in 1987.

But that’s not the question most folks are asking.  The market participants I talk to are generally trying to answer the question “If interest rates go up (this year, or next year), will prices go down (this year, or next year)?”  Is it a causal relationship?

What do you think?  Personally, beyond long term growth, I don’t see a strong relationship in the data, and neither is a solid correlation revealed in geeky statistical analyses.

Why isn’t the correlation better?

Higher interest rates do equate to lower affordability for a particular household, but why doesn’t that relationship translate well into median prices?

A few suggestions:

  1. Median prices are not the best way to measure market trends–overall dollar volume and the raw number of sales may provide more insight (and material for a future article)
  2. Hawaii’s population continues to grow faster than new housing units are developed–fundamental demand grows incrementally in both good times and bad. (Which explains the overall upward trend in prices, but not the ups and downs in particular years)
  3. When monthly payments go up, families still need shelter.  For those families contemplating a home purchase, spending on discretionary items will likely suffer first (say vacations or luxury items)–these spending habit adjustments allow families to absorb a certain amount of extra monthly payment caused by increased interest rates.
  4. When prices start to decline, sellers may opt not to put their home on the market.  Financially stable homeowners can afford to “hold out” for their desired price, which restricts supply, and in turn has a stabilizing effect on prices.

Frankly, when I began researching the data for this article, I expected to see a pretty reasonable relationship between affordability and median prices–instead, we see that from the perspective of a current homeowner, prices appear not to fluctuate on a “dollar for dollar” basis with interest rates. From an appraiser/appraisal perspective, it is imperative to observe how the market reacts to the rising rates that are currently anticipated, not just automatically assume lower prices if interest rates rise.

Comments and/or Questions?  Please leave them in the comments section below–I’d be happy to clarify or expand.

Aloha, Chris