Maui Million Dollar Home Sales ($1.0M+) – Day 1 of 10 – “Where are the million dollar homes located?”

Since January 1, 2012, a total of 231 “million dollar plus” homes have sold in Maui County, generating a total dollar volume in excess of $525 million.

There are many ways that Hawaii real estate appraisers analyze luxury sales statistics.  Because a proper market study for this segment would run many pages, I will be posting one analysis per day for the next ten days.

Day 1 of 10 – Maui Million Dollar ($1.0M+) Single Family Homes By District

Consider the following graph and chart:

Day 1 - Maui $1.0M Sales By District

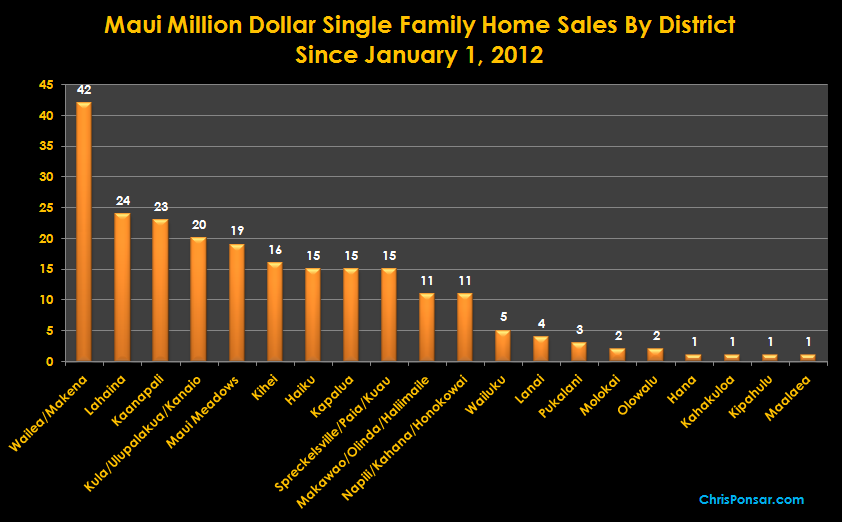
Maui Million Dollar Home Sales By District

Maui Million Dollar ($1.0M+) Single Family Homes By District
Sold From 1/1/2012 through 9/16/2013
District # of Sales % of Total
Wailea / Makena 42 18.2%
Lahaina 24 10.4%
Kaanapali 23 10.0%
Kula / Ulupalakua / Kanaio 20 8.7%
Maui Meadows 19 8.2%
Kihei 16 6.9%
Haiku 15 6.5%
Kapalua 15 6.5%
Spreckelsville / Paia / Kuau 15 6.5%
Makawao / Olinda / Haliimaile 11 4.8%
Napili / Kahana / Honokowai 11 4.8%
Wailuku 5 2.2%
Lanai 4 1.7%
Pukalani 3 1.3%
Molokai 2 0.9%
Olowalu 2 0.9%
Hana 1 0.4%
Kahakuloa 1 0.4%
Kipahulu 1 0.4%
Maalaea 1 0.4%
Total 231 100.0%

Maui’s three resort districts of Wailea / Makena, Kaanapali, and Kapalua are in bold.  As shown, almost 35 percent of Maui’s million dollar home sales since January 1, 2012 come from these three master planned communities. The second tier visitor areas of Lahaina, Kihei, and Napili/Kahana/Makawao log an additional 22 percent of the “million dollar” single family home sales on the Valley Isle.

Maui Resort and Second Tier Neighborhoods

Maui Resort and Second Tier Neighborhoods


Bottom line:  Location matters.

While upcountry locales are showing strong sales figures in the million dollar and above segment, Maui’s master planned resorts of Wailea/Makena, Kaanapali, and Kapalua lead the way.

Questions or comments?  Please leave them in the comment  box below, I would be happy to clarify and/or expand.

Aloha, Chris

Hawaii Four Seasons Hotels – A resort real estate appraiser’s friend when data is tough.

Imagine you’re an appraiser in Hawaii, and you’re given the enviable task of appraising an oceanfront homesite in the Manele Resort on Larry Ellison’s island of Lanai.

There are only eleven oceanfront lots currently developed in the resort (as shown roughly in the aerial below) and only one lot has sold in the last decade (Lot 130, for $3,612,500 in May 2011):

Lanai Oceanfront with Parcel Shapes

Manele Resort – Eleven Oceanfront Homesites
Photo Source: Bing Maps

The sale of Lot 130 is a godsend, but other than that, what is an appraiser to do for comps?

We can’t very well do a one comparable appraisal: We’ve got to go off island.

Two resort areas of the State of Hawaii that are similar to Manele Bay in terms of climate and resort appeal are Wailea (Maui) and Hualalai (Big Island).  All three neighborhoods have oceanfront homesites that could potentially provide sale comparables, and all three master planned communities are home to a prestigious Four Seasons resort!

Four Seasons Manele Bay

Four Seasons Manele Bay

Four Seasons Hualalai

Four Seasons Hualalai

Four Seasons Wailea

Four Seasons Wailea

What gives? Being (arguably I’m sure) the most prestigious hotel operator (“flag”) in the State of Hawaii, Four Seasons resort properties must meet certain strict criteria in order to qualify as a potential member of the brand.  Each of the three resorts on Lanai (Manele), Maui (Wailea), and the Big Island (Hualalai) are world class hotels that were constructed between 1989 and 1996, and have been well maintained in the interim.   As such, the physical plant of each resort should have reasonably similar cost/value attributes. (The Hualalai resort is a newer “bungalow-style” design that likely has more market appeal)

Under the assumption that each of the three properties benefit from first class or better improvements, differences in room rates likely capture a good portion of the market’s preference for a specific location/resort.  For an appraiser starved for data in a highly-unique sub-market like Manele Bay/Lanai, hotel room rates can provide much needed market support for potential location adjustments.

Consider the following:

FOUR SEASONS – HAWAII OCEANFRONT RESORTS 
Best Available Room Rate – August 19, 2013
Island Resort Hotel Name Year Built Room Rate
Big Island Hualalai Four Seasons Resort
Hualalai at Historic Kaupulehu
1996 $920
Maui Wailea Four Seasons Resort
Maui at Wailea
1989 $595
Lanai Manele Four Seasons Resort
Lana’i at Manele Bay
1989 $459

That’s right, the best available room rate at the Four Seasons Hualalai is DOUBLE the same at Manele Bay!

The following chart shows the relationship of each hotel to its Manele cousin, and the indicated adjustment to equate each room rate to Manele:

Downward appraisal adjustments of 23 percent (Wailea) are serious business, never mind 50 percent allowances (Hualalai).  But for the appraiser who is digging deep for market support for a location adjustment, comparative hotel room rates are an interesting value indicator to consider.  In a future article I’ll examine the three neighbor island resorts in greater detail and see if these price relationships hold.

Questions, comments?  Please leave them in the comment box, I would be honored to clarify and/or expand.

Aloha, Chris

Resort Homesites – Front Row vs. Second Row – A Big Island Paired Sales Analysis

Hawaii real estate appraisers are often asked to value residential properties that have spectacular ocean views.

Not a bad gig, I admit.

I recently did some appraisal work in Maniniowali, a luxury subdivision in the Kukio membership community on the Big Island of Hawaii.

I was valuing a front row lot, and this time, fortunately, there were several recent sales of similar properties to analyze.  But this is not always the case.  In high-end resort subdivisions, sales occur relatively infrequently–as such, quality comparables are sometimes hard to come by.

When appraising oceanfront or front-row properties, it is common to have no recent front-row sales in the subject subdivision.  But often times, there are timely sales of second row lots that can give an appraiser a better sense of values in the front row market.

Consider these two properties at Maniniowali:

Manini Paired Sale AerialImage Source: Bing Maps  (Click to Enlarge)
Manini Paired Sales Tax MapHawaii County Tax Map  (Click to Enlarge)

The aerial photo and tax map show a front row homesite, Lot 14, and a second row homesite, Lot 6.

For persons interested in real estate analysis, especially appraisers, these transactions are a stroke of analytical luck because they:

  • Closed just six days apart, in early May 2013
  • Both have ocean views
  • Are similar in size
  • Have the ability to purchase a membership in the same exclusive club (Kukio)

In short, a perfect opportunity for a pure paired sales analysis! (An appraiser geek term that speaks to the ability to test the value impact of a single, isolated variable)

The chart below shows a paired sales analysis for this set of comparables:

Manini paired saleSource: Chris Ponsar. MAI  (Click to Enlarge)

As shown, the second row lot at Maniniowali sold for approximately 27 cents on the dollar compared to its front row counterpart.  Said differently, Lot 14 sold for 3.6 times the price of Lot 6.

As an appraiser, I use relationships like this to help me in situations where I am challenged for data.  Obviously, this is only one pairing, and I’ll post similar paired sales of front row and second row lots as I come across them, but to the extent this relationship becomes a consistent trend, an appraiser may be able to check the reasonableness of their value conclusions for a front row lot against sale prices of second row lots, and vice-versa.

Comments and/or Questions?  Please leave them in the comments section below–I’d be happy to clarify or expand.

Aloha, Chris