Maui Million Dollar Home Sales ($1.0M+) – Day 6 of 10 – “How much land do they have?”
September 23, 2013
From January 1, 2012 through September 16, 2013, a total of 231 “million dollar plus” homes sold in Maui County, generating total volume in excess of $525 million. There are many ways that Hawaii real estate appraisers analyze sales statistics for luxury homes. Because a proper market study for this segment would run many pages, I am posting one article per day for ten days.
Day 6 of 10 – Maui Million Dollar ($1.0M+) Single Family Homes By Land Area
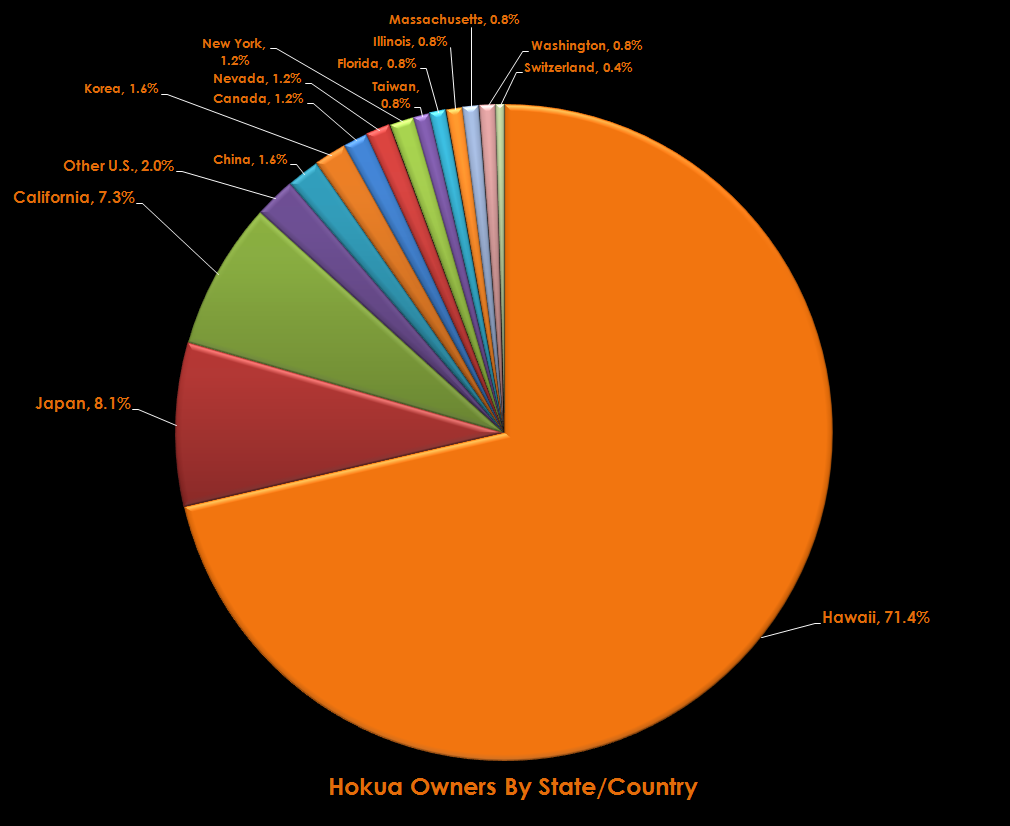
Consider the following graph, which categorizes the Maui million dollar home sales by their lot sizes:
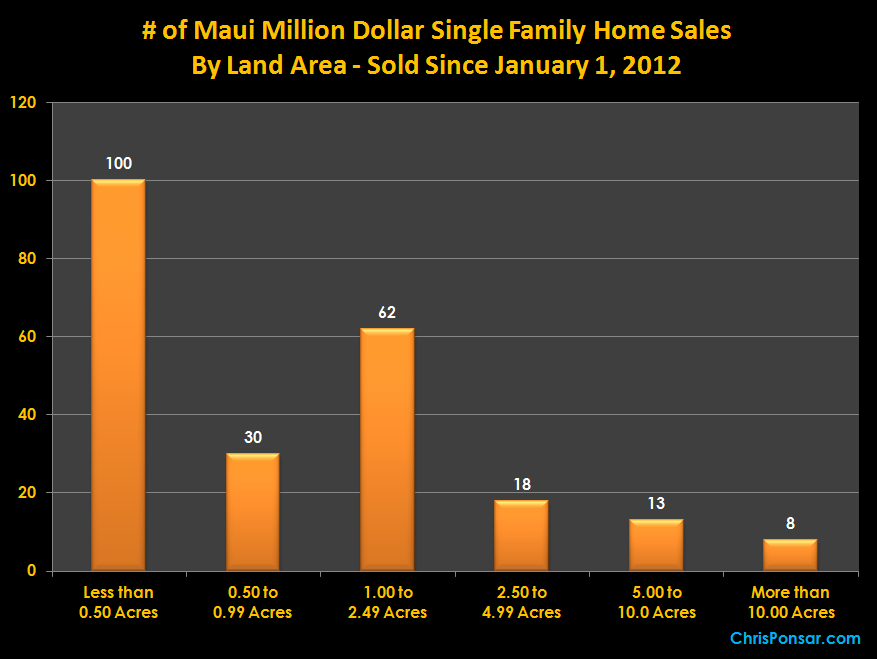
Maui Million Dollar Home Sales By Land Area
If you are unfamiliar with the luxury home market in Hawaii, the data presented on this graph might be counter-intuitive. As shown, most million dollar home sales are on lots that are smaller than half an acre in size, and only a handful of transactions are on tracts larger than ten acres.
Bottom Line: Once Again, Bigger Isn’t Necessarily Better
Not many people would argue that, all things being equal, more land area is usually better. But on Maui and throughout the Hawaii high-end residential sector, an experienced real estate appraiser understands that beach frontage and ocean views are the primary drivers of market value. Since near-ocean properties are typically subdivided into smaller land area configurations, it is easy to see how the most common high-dollar sales have smaller lots.
Questions or comments? Please leave them in the comment box below, I would be happy to clarify and/or expand.
Aloha, Chris


Recent Comments